The Raman effect was discovered simultaneously by Raman and Krishnan1, and by Landsberg and Mandelstam2 in 1928. It was Raman, however, who was awarded with a Nobel prize in 1930 for its discovery.

The effect consists in the shift in frequency of a small fraction of the light scattered by a sample. This shift is related to the vibrational states of the constituent atoms of the sample, and it can be regarded as a fingerprint of the material. The Raman signal is very weak in comparison to the intensity of the elastically scattered laser light. However, by filtering the latter, it is possible to resolve the Raman signal and characterize the sample, analyzing it quantitatively or qualitatively.
A classical approach
To understand the Raman effect, we have to introduce briefly the interaction taking place between the vibrations of the material and light. The vibrational state of a molecule composed by N atoms is completely defined by the temporal evolution of the three spatial coordinates for each of the atoms. Thus, in a classical approach, the solution is given by solving the 3N Lagrange equations (one for each particle in each of the three dimensions); giving 3N solutions. Three of them correspond to all the atoms moving in the same direction (translational movement), and another three correspond to rotations, in both cases with respect to each one of the axes. The rest of the solutions, 3N-6, correspond to the normal vibrational modes, where the atoms vibrate in phase with each other.
Since light is an electromagnetic wave, it can interact with positive and negative charges in a molecule. For instance, electrons may absorb an incident photon and be promoted from the valence band to the conduction band in a semiconductor. Also, the vibrational state of the atomic core can also change by interacting with infra-red light, by absorbing a photon and emitting a phonon. However, when the frequency of the light is far away from the vibrational frequency of the molecule, the main process taking place is the electronically assisted scattering of the light.
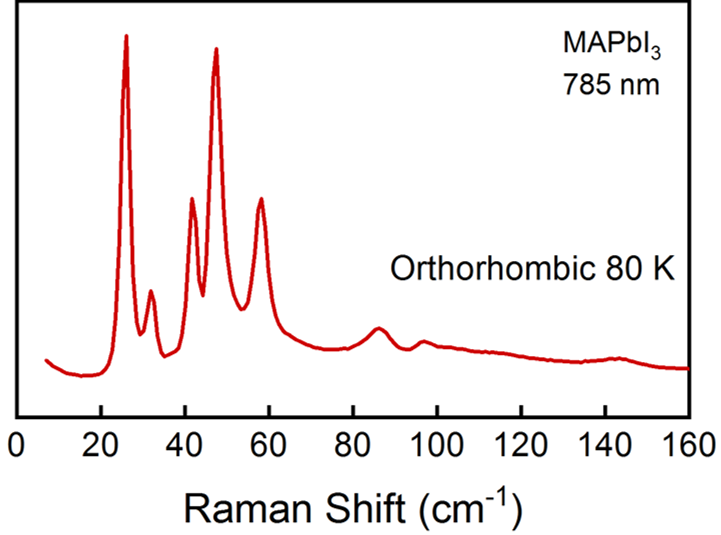
Figure 1. Example of Raman spectra of MAPbI3 at 80 K, in the orthorhombic phase. The excitation laser wavelength was 785 nm. The range 0 – 160 cm-1 correspond to the inorganic cage modes.
The dipole moment of a molecule (P) can vary with an external electric field (E). The strength of this interaction depends on the polarizability (α), according to the following equation:
![]()
Here, E = E0·cos(ω0t) is the external electric field, oscillating with an angular frequency ω0, and α is the polarizability of the molecule (a second rank tensor), which can be expanded to first order in a Taylor series as:

Being q = q0·cos(ω0t) a generalized coordinate.
The induced dipole moment P, proportional to the scattered electric field Es, is:

Which, by applying the trigonometry relation 2·cos(A)·cos(B) = cos (A+B) + cos (A-B) , leads to:

The first term corresponds to the Rayleigh scattering, i.e. elastic scattering, where the scattered light frequency is unchanged. The second term, on the other hand, shows a shift in the frequency of the scattered light with respect to the incident one; this is the Raman effect. The scattered frequencies are (ω0 – ω) and (ω0 + ω), corresponding to the so-called Stokes, and anti-Stokes processes, respectively. The latter presents a lower probability to happen than the former, because it requires an occupied excited state to take place (See Figure 2(c)), which is more unlikely according to a Maxwell-Boltzmann distribution of states for a given temperature. Besides, in an anti-Stokes process a phonon is absorbed, so it also depends on the number of phonons available at that moment. Figure 2 illustrates the three different types of light scattering.
Also, it is important to note that the Raman effect needs the factor (∂α/∂q)0 to be different than zero. That is, only the vibrations that lead to a change in the polarizability of the molecule are Raman active. A useful tool to determine the activity of the vibrational modes is group theory. Each mode transforms according to irreducible representations of the symmetry group of the molecule (or the crystal), and, in order for any derivative (∂α/∂q)0 to be zero, α and q must belong to different symmetry classes3. So, a mode is Raman active only if its normal coordinate transforms in the same way of any of the α(q) matrix components. The number and symmetry of the active Raman modes in a crystal can be deduced thus by looking at the group symmetry character tables for a given crystal structure.
A quantum-mechanical view

Figure 2. The three types of light scattering processes. (a), Rayleigh Scattering, (b) Raman Stokes and (c) Raman anti-Stokes. In Raman scattering, the energy of the scattered photon has increased (or decreased) a quantity equal to the difference in vibrational energy of the molecule after interacting with the excitation light (it absorbed or emitted a phonon in the process). The top energy level is a virtual state. However, in resonant Raman scattering this level would be either real or close to a real one.
As mentioned above, typically the Raman signal is very weak compared to the elastically scattered light. However, this signal may be increased by up to 6 orders of magnitude in resonance conditions. Usually, as is shown in Figure 2, scattering happens promoting the molecule to a virtual energy state for a very short period of time. However, if the excitation light energy matches the energy of a real transition, such as the promotion of a valence band electron to the conduction band, then resonance happens and the Raman signal intensity is increased. For solids and liquids, however, the photoluminescence produced after the excitation of electronic states beyond the bandgap of the material may mask the Raman spectra, complicating its recognition.
Hands On
Figure 3 (a) shows a spectrometer (LABRAM HR 800) used in one of the Nanopto’s group laboratories to measure Raman and photoluminescence spectra. In this case, the sample is located inside a pressure cell.
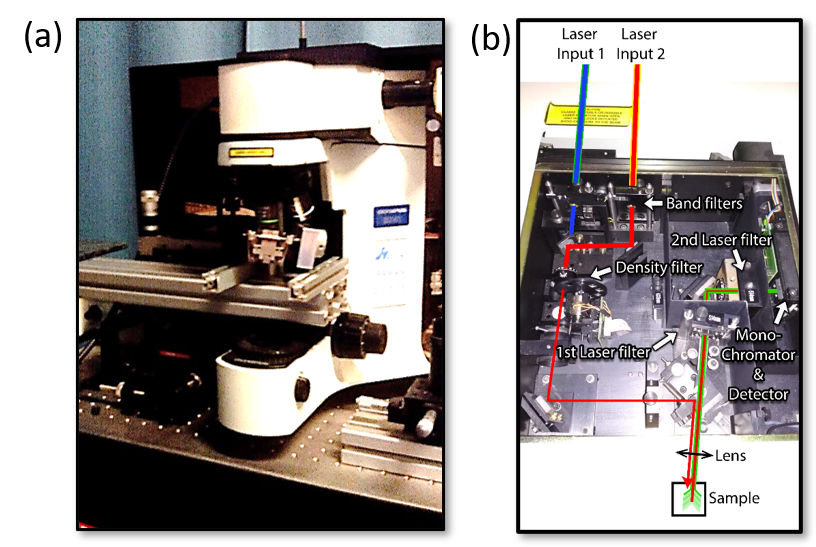
Figure 3. (a) Olympus BX41 microscope, integrated in the Jobin Yvon LABRAM HR 800 spectrometer used to measure Raman and photoluminescence. (b) Insides of the spectrometer LABRAM HR 800. The light path is highlighted for clarity. There are two openings, to make it easier to change the excitation wavelength by just moving a mirror.
The scattered light from the sample is collected back again by the system (backscattering configuration), where the incident laser light is filtered, and the rest of the signal is spread in frequency by a diffraction grating, to be finally detected with a liquid nitrogen-cooled, charged coupled device (CCD) camera. See Figure 3 (b) for further details of the working mechanism inside this optical device, and Figure 1 for an example of a Raman spectrum obtained measuring MAPbI3.
References
- Raman, C. V. & Krishnan, K. S. A new type of secondary radiation [11]. Nature 121, 501–502 (1928).
- Landsberg, G. & Mandelstam, L. Über die Lichtzerstreuung in Kristallen. Zeitschrift für Phys. 50, 769–780 (1928).
- Barbillat, J. et al. Spectrométrie Raman. in Techniques de l’ingenieur traité Analyse et Caractérisation (1999).
Post by: Adrián Francisco López
20/11/2020